Showing posts with label visualization. Show all posts

Wednesday, March 4, 2009

An Update

I have not been posting regularly for the past few weeks, on account of feeling the whooshing sound of deadlines going by.
Thankfully, I have been able to meet the dates for the PACIS 2009 and AMCIS 2009.
I already had a fair number of things to say about Collaborative Knowledge Creation in general and Wikipedia in particular, based on the findings of my longitudinal network analysis studies of different language Wikipedias. (Abstracts uploaded here )
I will put up the full papers shortly, as soon as the review process concludes.

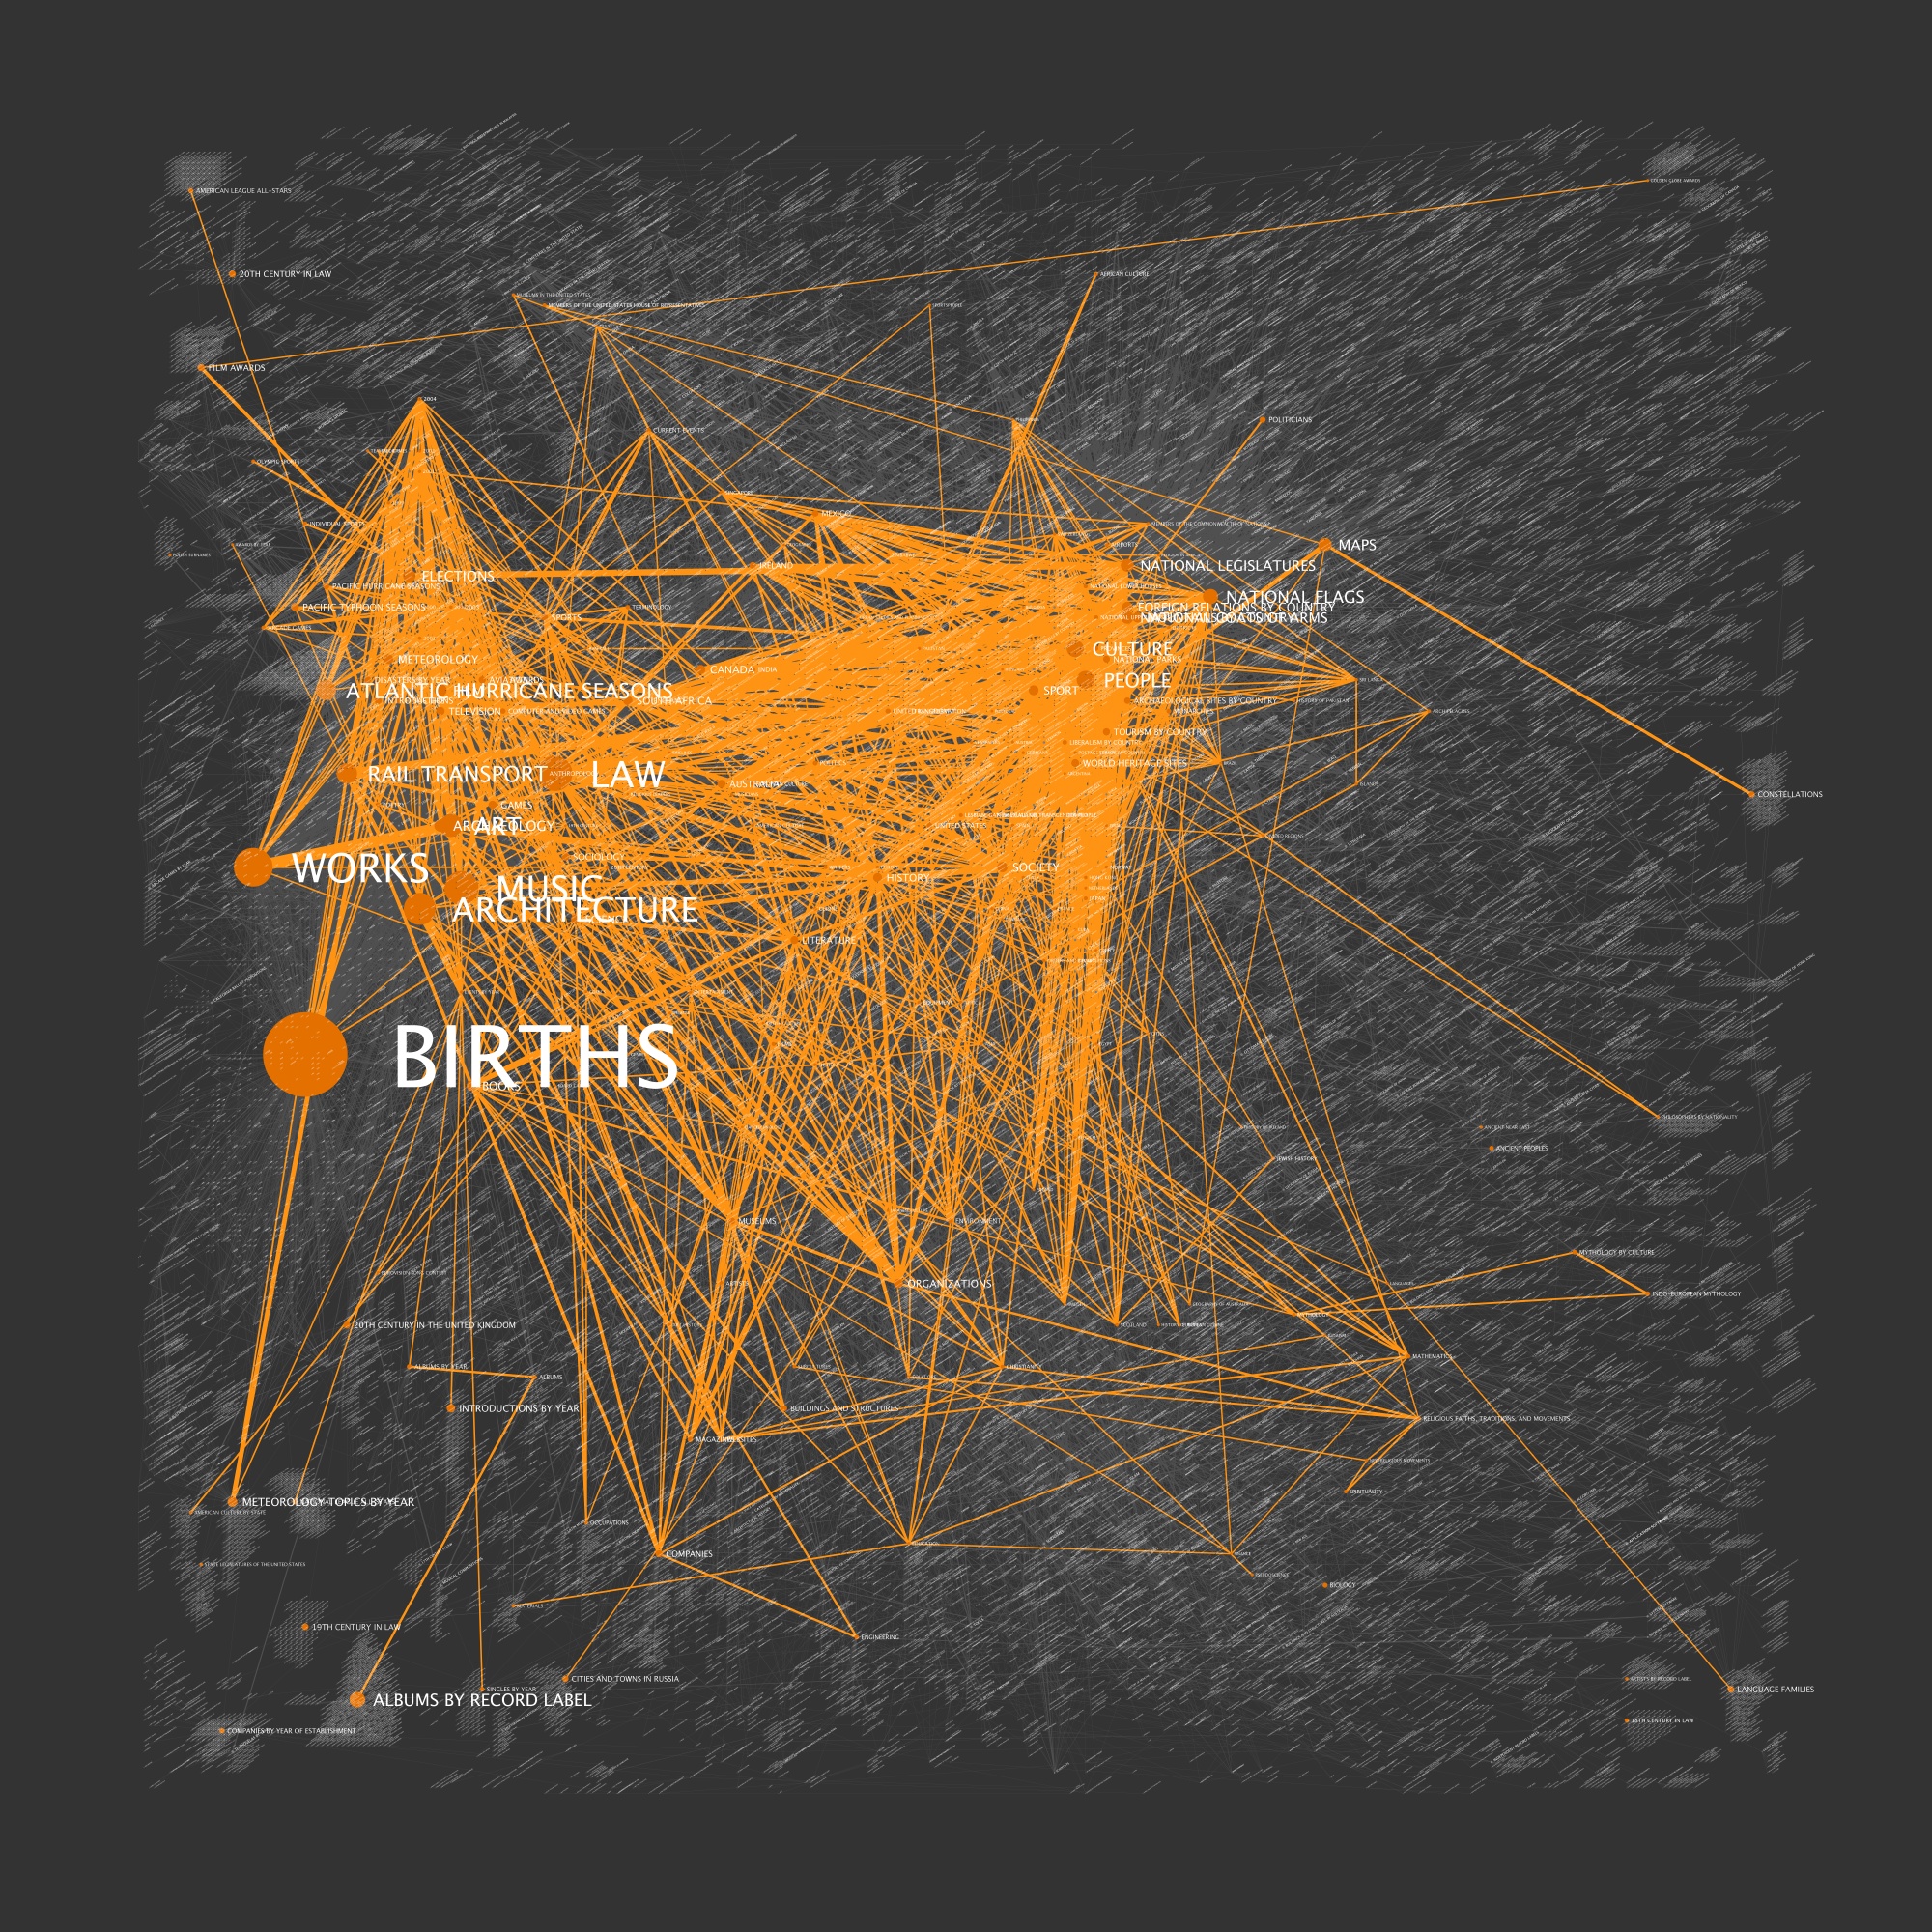
Meanwhile, here's one of the visualizations from my network analysis of the interaction graphs of Cebuano Wikipedias. More shortly (one more deadline coming up the hill!)

Thursday, May 15, 2008

Learning about the Social Networks behind Wiki

Reference: Korfiatis, Poulos and Bokos, “Evaluating authoritative sources using social networks: an insight from Wikipedia”, Online Information Review Vol. 30 No. 3, 2006 pp. 252-262


Two Layers of Network

(1) The articles network.
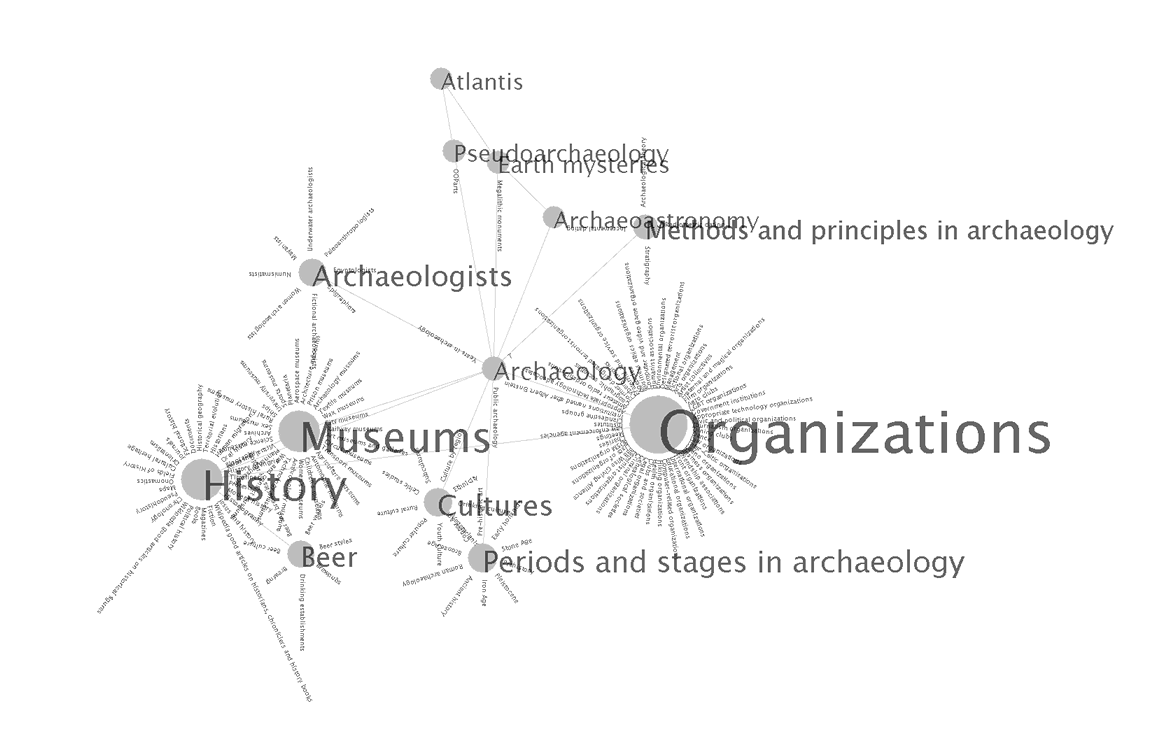
Every article in the Wikipedia contains references to other articles as well as external references. A set of links used for classification purposes is also available in most of the active articles of the encyclopedia. Every article represents a vertex in the article network and the internal connections between the article edges of the network.

(2) The contributors network.


Wikipedia is a collaborative writing effort, which means that an article has multiple contributors. We assume that a contributor establishes a relationship with another contributor if they work on the same article. In the resultant signed network, a vertex represents each contributor, and their social ties (positive or negative) are represented by an edge denoting the sequence of their social interaction.Visualization of the Social Network of contributors behind the article "Immanuel Kant"

...And of course, I had already mentioned Chris Harrison's WikiViz Project. Talk about beautiful graphs!


You can also have a look at the Clusterball Project. Dont miss the movie.

Wednesday, May 14, 2008

Visualizing Wikipedia

Chris Harrison, over at the Human-Computer Interaction Institute at Carnegie Mellon University has some beautiful visualizations of Wikipedia's network structure. He calls this project WikiViz.
http://www.chrisharrison.net/projects/wikiviz/index.html
Apart from the stunning visuals, I am thankful to Chris for two ideas that came to me:
- Can Visualizations in the form of Graphs of Wikipedia be analyzed from the point of view of Meme Theory?
- Can I use GraphViz (or similar tools) to develop visualizations for concepts in Religious Texts?
Chris has, in another interesting project, undertaken a visualization of the social network present in the Bible (http://www.chrisharrison.net/projects/bibleviz/index.html).
Similar visualizations for the Gita and Quran should be possible. What would be the motive?
Some vague thoughts swimming in my mind at this stage- Memes, Clusters, Selective Pressures, Evolutionary theories of Culture.